Toward Measuring Tool Impact: What can environmental planners learn from log and usage analysis?
Analyzing user behavior with computer science methods is common in commercial website design, where a subfield called web analytics uses electronically gathered quantitative data to gain insights about user behavior. Commercial companies use this information for a variety of purposes, from improving search engine performance and customizing a user’s experience to targeting ads in ways that may seem unnerving. What can be done with the information depends on two key factors: (1) what and how information is collected (2) laws, polices, and norms governing the use of information.
Public policy software tools generally make less use of metrics than commercial software, perhaps because of the public functions they serve and/or because they may fall under different laws governing the collection and use of personal information. At SeaSketch, we have been interested in the use of similar techniques to improve our user’s experience, since automatic metrics can provide useful information with much less cost and time then traditional evaluation techniques (e.g. surveying users). However, we are acutely aware that automatically collecting information can be sensitive and so have pursued the use of usage metrics carefully, with lots of input from managers and users.
From 2012 to 2014, Will McClintock and Chad Burt collaborated with Amanda Cravens, to investigate MarineMap, the predecessor to SeaSketch. One aspect of Amanda’s study was to experiment with using log and profile analysis techniques developed by computer scientists to see what we could learn about how users interacted with the MarineMap application during California’s Marine Life Protection Act Initiative, which sited marine protected areas along the state’s coastline.
Specifically, we correlated when and how often users loaded URLs that perform certain actions in the online software application (such as creating a proposal for where to site a marine protected area) with process milestones of interest (such as key meeting dates). We also performed aggregate of analysis of what kinds of users (e.g. everyone with government employee emails) were performing these actions. (For more details, download the report on the usage analysis.)
Since MarineMap’s log and profile files were not originally designed for this kind of analysis, the results of this study were relatively modest. Our experience underscores how the design of the software application impacts what kind of usage analysis can subsequently be conducted. Anyone interested in doing the kind of analysis attempted in this study should ideally think upfront about what kinds of information they might want to later gather. However, there can be tradeoffs between a design that would make sense for analytics purposes and what might make sense for the myriad other reasons design choices are made in the application development cycle.
For instance, more information about which groups of users accessed which types of geospatial layers could give quite a bit of insight into how different groups might be utilizing the application as a whole. This suggests that development teams planning to conduct similar log analyses should consider designing their applications and log files to capture profile information about which users are accessing URLs. However, capturing profile information makes the log files much more personally sensitive. Anyone doing log analysis on tools for public policy needs to carefully consider this social context in which analysis is taking place and particularly how privacy is viewed by citizens. Government agencies may also fall under laws that govern the collection and use of personal information.
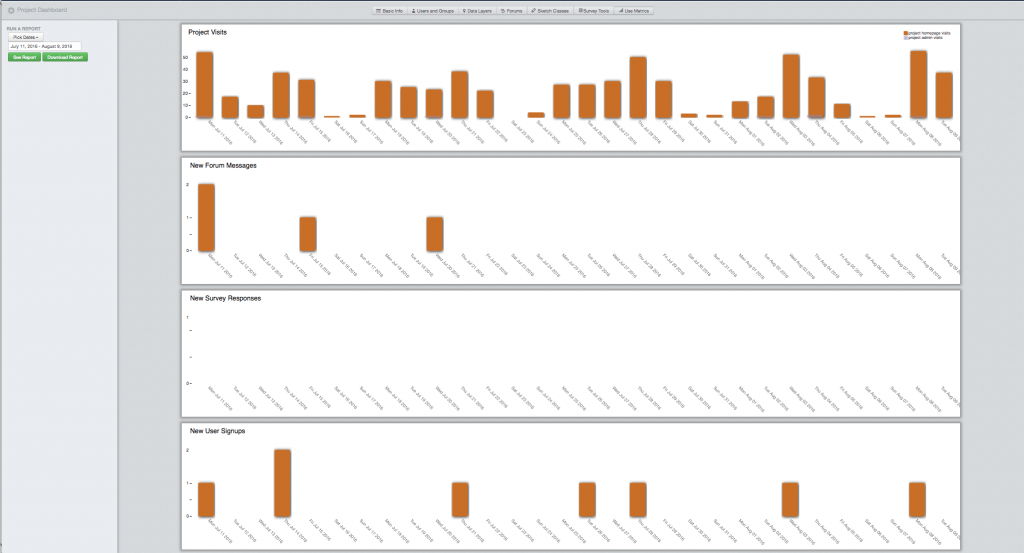
The lessons from the MarineMap study have influenced our approach to metrics in SeaSketch, which offers project administrators the ability to view summary statistics (see illustration below) and download more detailed use metric logs in spreadsheets. Summary statistics include the number of project visits, new forum posts, new survey responses and new user signups over a period of time defined by the administrator. The downloadable spreadsheets detail the number of new sketches (plans), messages, survey responses and visitations by individual users (including anonymous users). Because these use metrics may be viewed at any time by a project administrator, planners have a nuanced understanding of how the decision support tool is being used (or perhaps underused) by stakeholders over time. This information may be used to configure SeaSketch or adjust the planning process to make more effective use of the tool. For example, are there key stakeholders that have not used SeaSketch in a period leading up to an important decision? Are there steps one can take to provide assistance to them so that decisions are more inclusive or representative of all stakeholders?

We are interested to hear your thoughts on finding the appropriate balance and negotiating tradeoffs between greater information and privacy. Amanda is also interested in hearing from those who are considering the issue of metrics for decision support tools in other kinds of planning processes. She can be contacted via her website.
Amanda Cravens is currently a Research Social Scientist with the U.S. Geological Survey. The research described in this blog post was completed while she was at Stanford University.


